13.4 Confidence Interval for a Difference of Population Proportions
Suppose is a real number between 0 and 1, and suppose we want to build a confidence interval for the difference of two population proportions. If the same conditions hold that are needed to do the -test on the difference of two population proportions, then the following can be used to compute a confidence interval on the difference
| (13.3) |
Recall that is computed so that This is equivalent to and hence,
Example 13.4.1.
A researcher wanted to test the hypothesis that the proportion of women in Wisconsin who plan to vote in the upcoming election is from the proportion of men in Wisconsin who plan to vote in the upcoming election. She sampled 600 women, 324 of whom reported that they plan to vote. In a sample of 516 men, 258 reported that they plan to vote. Construct a 95% confidence interval for the true difference of proportions.
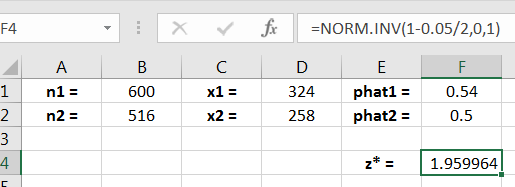
Solution: Let and denote the true proportions on women and men who intend to vote, respectively. The value of in Equation (13.3) is
as shown in Figure 13.3.
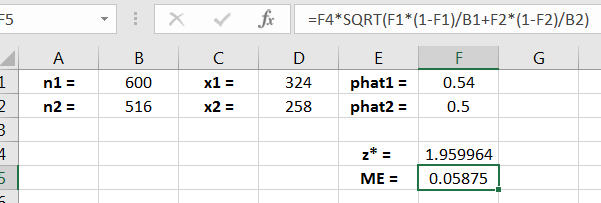
Recall that the “margin of error” for a confidence interval is the half-width of the interval. Thus, the margin of error calculation for this interval is shown in Figure 13.4.
The left and right endpoints of the interval calculations are shown in Figure 13.5.
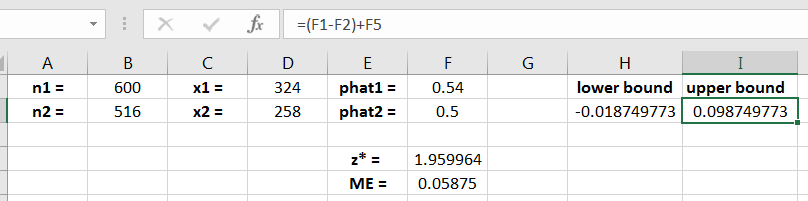
Hence, we are 95% confident that the true difference of proportions is between -0.019 and 0.099. Since the interval contains 0, the interval does not provide strong evidence that the proportions and are unequal.
Example 13.4.2.
A study was conducted to assess whether Saint Agatho College student satisfaction differed from 10 years ago. From 10 years ago, a survey was conducted in which 100 students were asked if they were satisfied with their experience at Saint Agatho. Of the 100, 75 answered “yes.” The same survey was conducted this year, and of the 100 surveyed, 83 replied “yes.” Construct a 90% confidence interval for the true difference in proportions of student satisfaction between current students and students from 10 years ago. Assume that students enrollment in both years exceeded 2,000.
Solution: Let be the population proportion of current students who would answer “yes,” and let be the population proportion of students from 10 years who would answer “yes.” Note that the conditions to use Equation (13.3) are met. The computed values for the 90% confidence interval are shown in Figure 13.6.
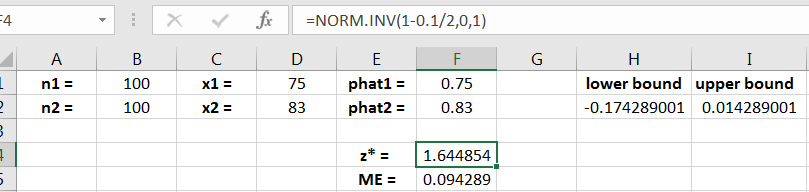
Thus, we are 90% confident that the true difference of proportions is between -0.174 and 0.0142, giving weak evidence that the true proportions are unequal.
Exercises
-
1.
A college provost wished to test whether freshmen and sophomores take more than 16 credits more often than juniors and seniors take more than 16 credits. In the fall semester, she took a random sample of size 200 from freshmen and sophomores, and a random sample of size 200 from juniors and seniors. Of the former, 34 took more than 16 credits that semester, and of the latter, 25 were taking more than 16 credits. At the 10% level, compute and interpret a 95% confidence interval for the true difference between the proportion of freshmen and sophomores that take more than 16 credits and the proportion of juniors and seniors take more than 16 credits.
-
2.
A basketball player wishes to test whether she is more accurate when shooting three pointers from the top of the key versus shooting from the corner. To randomize the order in which she took shots, she flipped a coin before each shot, or until she reached a total of 50 shots from each position. If the coin flip was heads, she shot from the top of the key, and tails meant she shot from the corner. Of the 50 from the top of the key, she made 40 shots, and from the corner, she made 34 of the 50 shots. Compute and interpret a 90% confidence interval for the difference between the true proportion of three pointers made from the top of the key and the true proportion of shots made from the corner.