13.3 Testing a Difference of Two Population Proportions
| Goals: |
|
Suppose that Population 1 and Population 2 have proportions and , respectively, of things of Type A. Suppose further that we want to make a decision on In this situation, it may be appropriate to perform a Two-Independent Samples -Test on Two Proportions, which we introduce in this section.
Let and denote the respective sample sizes of the samples taken from Populations 1 and 2, respectively. Similarly, let and denote the counts of things of Type A in each sample. These counts produce sample proportions and which are point estimates for the unknown and and hence, is a point estimate for i.e.,
In order to use the hypothesis test, the following conditions must be met:
-
1.
The two samples are independent.
-
2.
The samples are simple random samples.
-
3.
The samples are sufficiently large. This is met if
Algebraically, this is equivalent to
(13.1) In words, “sufficiently large” means that each sample contains at least 10 things of Type A and at least 10 things not of Type A.
-
4.
Each sample is not too large relative to the size of the population, i.e., each sample size is not more than 5% the size of the corresponding population.
If these conditions are met, then the -score for the observed data is
| (13.2) |
where
The value is called the pooled sample proportion. The following examples show application of the test.
Example 13.3.1.
A researcher wanted to test the hypothesis that the proportion of women in Wisconsin who plan to vote in the upcoming election is greater than the proportion of men in Wisconsin who plan to vote in the upcoming election. She sampled 600 women, 324 of whom reported that they plan to vote. In a sample of 516 men, 258 reported that they plan to vote. At the 5% level of significance, is there significant evidence that a greater proportion of women intend to vote?
Solution: Let and be the population proportions of women and men who intend to vote, respectively. Then the competing hypotheses can be written as follows:
Note that the direction of extreme is to the right.
The sample data are as follows:
Note that the conditions for the “samples are sufficiently large” in (13.1) are satisfied, so we can use the test. We have and and the pooled sample proportion is
Thus, the test statistic is
Now the -value is
Now so the -value is larger than and we fail to reject Thus, there is insufficient evidence that supports the claim that a greater proportion of women intend to vote.
Two Remarks:
-
1.
Here are the calculations in Excel. The highlighted cell shows the calculation of Equation (13.2):
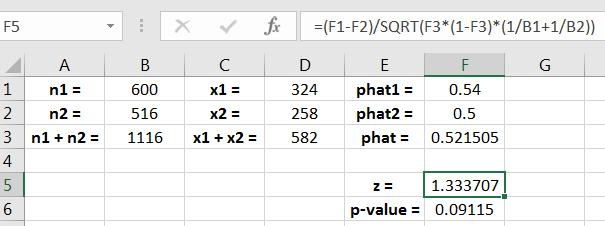
Figure 13.1: Excel Calculations -
2.
In failing to reject recall that a Type II error may have been made. But, the probability that the error was made is not instead it is 0 or 1. It is 0 if the error was not made, and 1 if the error was made.
Example 13.3.2.
A study was conducted to assess whether Saint Agatho College student satisfaction had improved compared to 10 years ago. From 10 years ago, a survey was conducted in which 100 students were asked if they were satisfied with their experience at Saint Agatho. Of the 100, 75 answered “yes.” The same survey was conducted this year, and of the 100 surveyed, 83 replied “yes.” At a 10% significance level, determine if there is significant evidence that student satisfaction has improved. Assume that student enrollment at Saint Agatho has exceeded 2,000 during the last 10 years.
Solution: Let be the population proportion of students 10 years ago who would have answered “yes,” and let be the population proportion of current students who would answer “yes.” Then the competing hypotheses can be written as follows:
Note that the direction of extreme is to the left.
The sample data are as follows:
Note that the conditions to use the -test on two proportions are met. We have and and the pooled sample proportion is
Thus, the test statistic is
Now the -value is
Now so the -value is smaller than and we reject Thus, there is significant evidence that student sanctification has improved compared to 10 years ago.
Two Remarks:
-
1.
Here are the calculations in Excel. The highlighted cell shows the calculation of Equation (13.2):
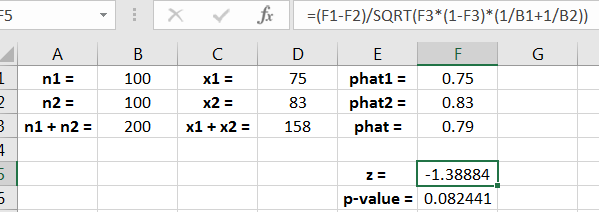
Figure 13.2: Excel Calculations -
2.
In rejecting recall that a Type I error may have been made. However, the probability that the error was made is not instead it is 0 or 1. It is 0 if the error was not made, and 1 if the error was made.
13.3.1 Exercises
-
1.
Mark the following statements as True or False:
-
(a)
can be negative.
-
(b)
can be negative.
-
(c)
can be larger than .
-
(d)
In Equation (13.2), the value of can be negative.
-
(e)
and can be negative.
-
(f)
The p-value can be negative.
-
(g)
The p-value has to be less than alpha in order to reject .
-
(a)
-
2.
Compute and for the following scenarios:
-
(a)
-
(b)
-
(c)
-
(d)
-
(a)
-
3.
Compute for each of the situations in problem 1.
-
4.
Compute Z for each of the situations in problem 1.
-
5.
A college provost wished to test whether freshmen and sophomores take more than 16 credits more often than juniors and seniors take more than 16 credits. In the fall semester, she took a random sample of size 200 from freshmen and sophomores, and a random sample of size 200 from juniors and seniors. Of the former, 34 took more than 16 credits that semester, and of the latter, 25 were taking more than 16 credits. At the 10% level, test whether there is sufficient evidence that freshmen and sophomores take more than 16 credits more often than juniors and seniors take more than 16 credits. State the competing hypotheses, the direction of extreme, compute the test statistic and corresponding -value, and interpret. Address, as well, why using this test was appropriate. Assume that both populations have at least 2,000 students.
-
6.
A basketball player wishes to test whether she is more accurate when shooting three pointers from the top of the key versus shooting from the corner. To randomize the order in which she took shots, she flipped a coin before each shot, or until she reached a total of 50 shots from each position. If the coin flip was heads, she shot from the top of the key, and tails meant she shot from the corner. Of the 50 from the top of the key, she made 40 shots, and from the corner, she made 34 of the 50 shots. At the 10% level, test whether there is sufficient evidence that she is more accurate when shooting three pointers from the top of the key versus shooting from the corner. State the competing hypotheses, the direction of extreme, compute the test statistic and corresponding -value, and interpret. Address, as well, why using this test was appropriate.