13.5 Simulation of Differences of Sample Proportions - Optional
The purpose of this section is to observe the behavior of under circumstances in which it is reasonable to use a normal distribution to approximate -values or to build confidence intervals. Suppose two large populations have population proportions and respectively. From population 1, we will simulate taking samples of size 100, and from population 2, simulated samples of size 200 will be drawn. Thus, we should observe normal-like behavior of
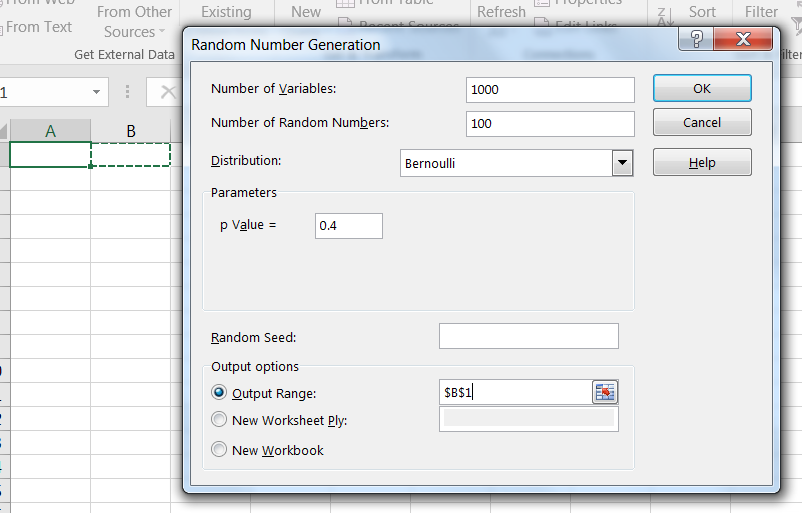
Using Excel’s random number generator, simulate taking 1,000 samples of size 100 from population 1, as in Figure 13.7. (Recall that Bernoulli trials are random events where the outcomes are either 0’s or 1’s, with the probability of observing a 1 a fixed value of for each trial.)
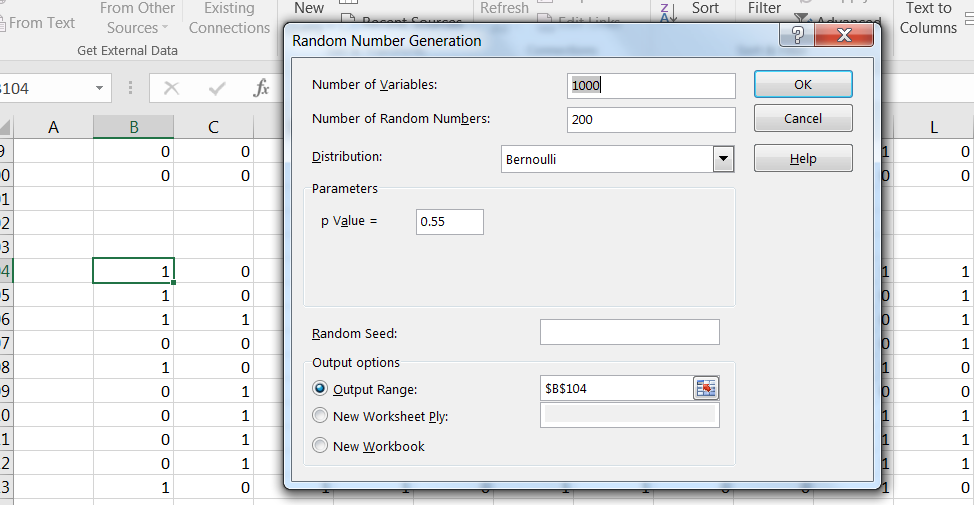
Similarly, simulate 1,000 samples of size 200 from population 2, as shown in Figure 13.8. It is convenient to place the samples a fews rows below the samples from population 1.
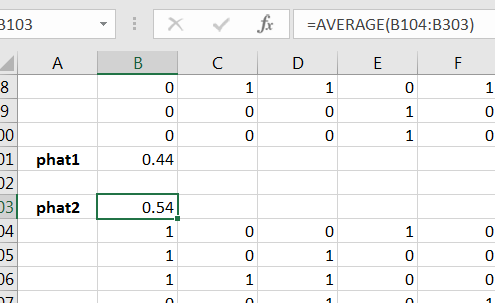
Compute and for the first two simulated samples, as in Figure 13.9.
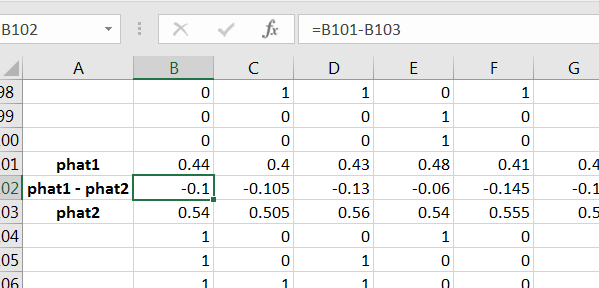
Then compute for the first pair of samples, then copy the three adjacent commands across for all of the samples, as in Figure 13.10.
If you create a histogram for the differences you’ll observe a bell-shaped distribution centered at as in 13.11.
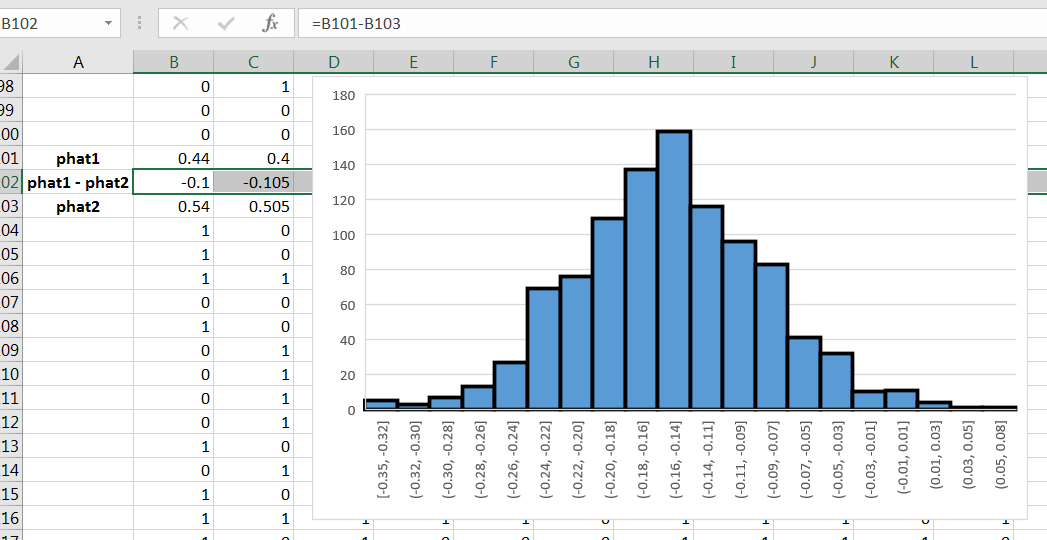
Further study of the simulated differences will add evidence that the differences have an approximate normal distribution.
Exercise - Optional
Pick values for and for two populations, then choose samples sizes and so that a normal distribution model is appropriate for Simulate a large number of ’s, and then show that the distribution of the simulated differences is approximately bell-shaped and centered at