9.2 A First Example
| Goals: |
|
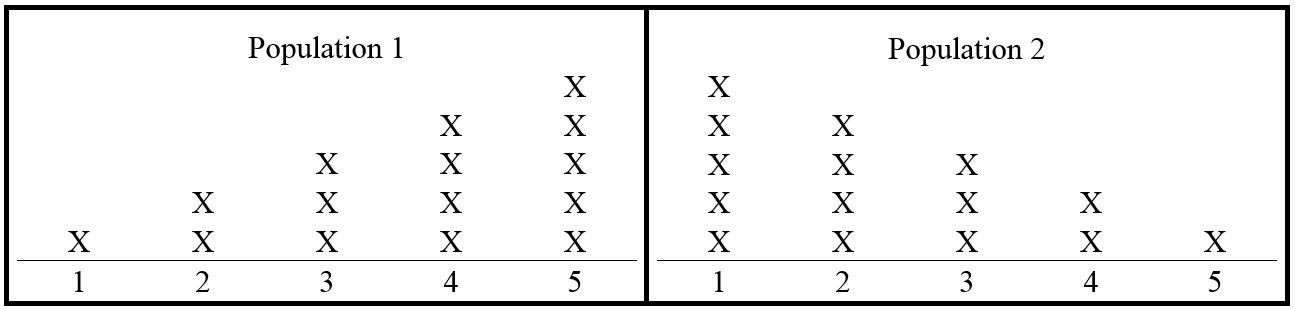
Suppose that there are two populations of numbers. Population 1 contains one 1, two 2s, three 3s, four 4s, and five 5s, whereas Population 2 contains five 1s, four 2s, three 3s, two 4s, and one 5. The two populations are represented in Figure 9.1.
Suppose that one of the populations is chosen at random, but without us knowing which was chosen. Now from the chosen population, suppose that a random sample of size 1 is selected. Based on the sample, we are to make a decision on the following hypotheses:
Note that the truth value of is well-defined, i.e., when a population is chosen, that determines whether is true or false. For example, if the chosen population is Population 2, then is false.
Since the sample is of size 1, it is reasonable to define the test statistic as the value of observed, so we’ll do just that.
9.2.1 Direction of Extreme - To the Left
Note that the smaller the selected value, the stronger the evidence against That is, if is true, then smaller values are less likely to be observed. This is called the direction of extreme. The direction of extreme is identified by looking at what test statistic values provide stronger evidence against the null hypothesis. In this example, the direction of extreme is said to be to the left, because on a number line, numbers get smaller as you move to the left (at least in the manner we usually draw them).
9.2.2 Decision Rule and Critical Value
In a hypothesis test, we must decide on what constitutes “significant evidence against .” This choice is called a decision rule. A decision rule will be of the form, “if we observe a test statistic of this value or more extreme, then we will reject ” For example, a decision rule could be:
-
We will reject if the number selected is 1 or less.
The chosen value of 1 is called a critical value.
9.2.3 Significance Level; and
If is true, then the chance of making a Type I error is called the significance level and is denoted by Recall that a Type I error occurs when is true, but the decision is to reject
A decision rule and significance level are equivalent. For example, suppose the decision rule is “reject if the number selected is 1 or less.” If is true, the chance of rejecting is Conversely, suppose that Then this would determine a decision rule of “reject if the number selected is 1 or less,” with the critical value being 1.
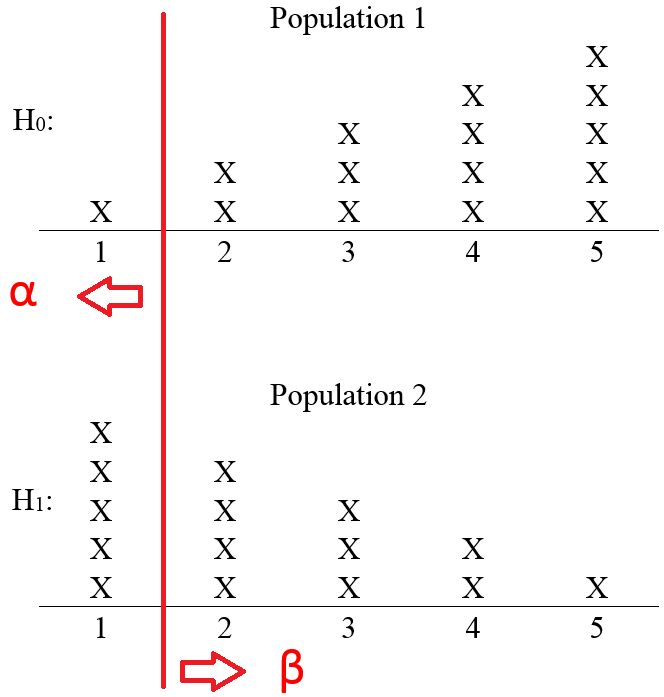
If is false, then the chance of making a Type II error is denoted by Recall that a Type II error is made when is false, but we fail to reject A decision rule or choice for both determine For example, suppose the decision rule is “reject if the number selected is 1 or less,” and suppose that is false. In order to fail to reject a number greater than 1 must be selected. If is false, the chance of that happening is Figure 9.2 gives a visual representation of the computation for computing and for this decision rule.
A choice of or decision rule leads to the following decision making scheme: The critical value and direction of extreme define a rejection region. If the test statistic falls within the rejection region, then is rejected, i.e., if the test statistic is at the critical value or more extreme, then is rejected.
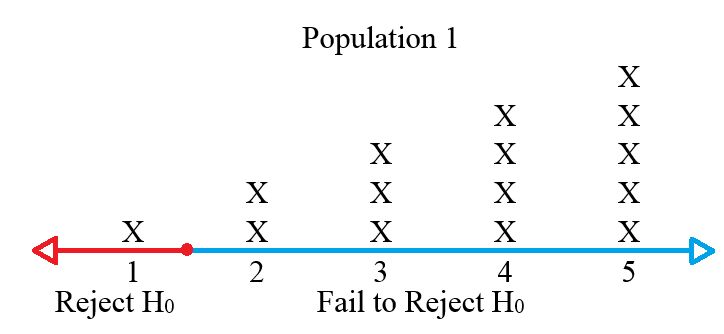
To illustrate, suppose that we again use the decision rule of “reject if the number selected is 1 or less.” And suppose upon selecting the population, the number 3 is chosen as the sample. Since 3 does not fall with the rejection region, we fail to reject i.e., there is insufficient evidence to reject Figure 9.3 gives a visualization of the regions.
How hypothesis testing is done varies by discipline, and varies by the vintage of the hypothesis tester. The “rejection region” approach is something you may well see, but it is a bit “old fashioned.” Officially, it is called the Classical Approach. A more modern hypothesis testing scheme is as follows: Instead of picking a decision rule, it is more common that the researcher picks a value for i.e., the researcher decides on an acceptable level of risk in making a Type I error.3838Recall that a Type I error cannot occur if the chosen is false. Since a Type I error is generally the more serious error, common choices for are 0.10, 0.05 or 0.01; the more serious a Type I error is, the smaller the chosen value of 3939Even smaller values of are used, for example in space flight, when an error can lead to catastrophic results. Instead of computing a critical value from the choice of the researcher computes a -value, which is discussed next.
9.2.4 -values
After choosing and picking designing an experiment and collecting the data, and computing the test statistic from the sample, the researcher then asks:
-
What is the probability of observing this test statistic, or anything more extreme, assuming is true?
This probability is called a p-value. The “more extreme” phrase in the -value question always references the direction of extreme, just as with the decision rule and computations of and Computing a -value is similar to computing in that the first step is to assume is true.
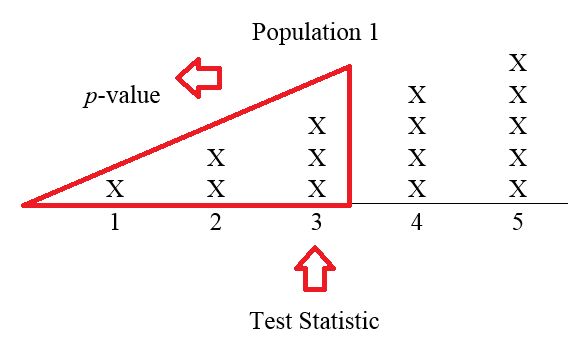
For example, suppose that the number 3 is chosen. Then the corresponding -value is computed by answering the following question: Assuming the chosen population is Population 1 ( is true), what is the chance of observing a 3 (the test statistic) or anything smaller (more extreme)? Thus, if a 3 is chosen, then the -value is 6/15, or , since there are six numbers in Population 1 that are 3 or less. Figure 9.7 illustrates.
To make a decision, the researcher compares the computed -value to the the choice for If the -value is then is rejected; otherwise one fails to reject This procedure is equivalent to the decision rule scheme. Why? The -value is if and only if the test statistic falls within the rejection region.
Some researchers have started to skip using an i.e., in reporting results, researchers simply report -values, and let readers themselves interpret whether the results are significant. We won’t do that in this text, i.e., we will consistently use a choice for in interpreting results.
Concepts Check
-
1.
If is false, what is the truth value of ?
Answer: True -
2.
When a researcher chooses what is the probability that is true?
Answer: 0 or 1 -
3.
If one fails to reject what type of error might have been made?
Answer: Type II, but remember that this error is possible only if is false -
4.
The direction of extreme is identified by looking at what values of the test statistic are less likely if is true.
Answer: True -
5.
True or false: The -value is the chance of observing the test statistic, or anything more extreme, assuming is true.
Answer: True -
6.
True or false: The significance level, is the chance of making a Type I error.
Answer: True, but remember that a Type I error is possible only if is true -
7.
Assuming the Population 1 / Population 2 scenario above, if the number selected is 2, what is the corresponding -value?
Answer: -
8.
Assuming the Population 1 / Population 2 scenario above, if the decision rule is “reject if the selected number is 2 or less,” what is the value of
Answer: same as above -
9.
Assuming the Population 1 / Population 2 scenario above, if the decision rule is “reject if the selected number is 2 or less,” what is the value of
Answer: Remember to assume is false, and that the voucher gotten is greater than $200, so -
10.
Suppose that in a hypothesis test, the researcher chose Suppose further that after computing the test statistic, the researcher got a -value of 0.0421. What is the researchers decision?
Answer: Reject -
11.
Suppose that in a hypothesis test, the researcher chose Suppose further that after computing the test statistic, the researcher got a -value of 0.0882. What is the researchers decision?
Answer: Fail to reject