8.2 Confidence Intervals for Proportions
| Goal: |
|
Recall that the sampling distribution for proportions becomes approximately normally distributed with and given and . With this in mind, we can then construct a confidence interval for proportions.
Theorem (Confidence Interval for ).
Assuming a random sample is taken with a sample proportion of , along with and , then the confidence interval for is given by
where is the critical value from the standard normal distribution such that .
For review on calculating , visit the previous section on finding a confidence interval for , knowing . We will assume here that you have a sufficient understanding of calculating .
Figure 8.5 has the commands needed to compute a confidence interval for . The table below summarizes them again.
| Action | Excel Commands | Python Commands |
|---|---|---|
| Compute the Square Root | sqrt(…) | |
| Compute | norm.ppf() |
-
•
The mean and sqrt commands require the library numpy . The norm.ppf command requires the library scipy.stats .
Let’s see an example in Excel and Python.
Example 8.2.1.
Given , , and , compute a confidence interval for in Excel.
Before we progress, we need to check the normality conditions: and . Since they hold true, we can proceed.
On a new sheet in Excel, in cell , type the string .
In cell , type the following command to compute , the critical value associated with .
In cells and , type the strings and .
Recall that the confidence interval for is
With this in mind, in cell compute the lower value of the confidence interval by typing the command
Similarly, in cell compute the upper value of the confidence interval by typing the command
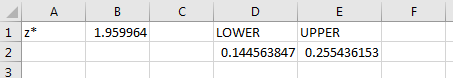
You should obtain for the 95% confidence interval for .
Example 8.2.2.
Given , , and , compute a confidence interval for in Python.
Before we progress, we need to check the normality conditions: and . Since they hold true, we can proceed.
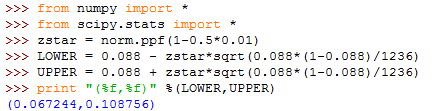
Remember to load numpy and scipy.stats since we are using Python. To do so, type:
| from numpy import * |
| from scipy.stats import * |
Let’s compute and store it to the variable zstar by typing the command
| zstar = norm.ppf(1-0.05*0.01) |
Note that .
Let’s name the lower value of the confidence interval as LOWER. At the prompt, type the following to assign it to LOWER.
| LOWER = 0.088 - zstar*sqrt(0.088*(1-0.088)/1236) |
Repeat the same process for the upper value of the confidence interval by typing the following command and storing it as UPPER.
| UPPER = 0.088 + zstar*sqrt(0.088*(1-0.088)/1236) |
Let’s have Python print out the confidence interval. Type the following.
| print "(%f, %f)" %(LOWER, UPPER) |
You should obtain the confidence interval . Figure 8.22 represents the layout you should obtain in Python when finished.
8.2.1 Exercises
-
1.
Answer each of the following statements as True or False.
-
(a)
stands for population proportion.
-
(b)
The confidence interval for attempts to estimate the location of the sample proportion.
-
(c)
The Student’s -distribution is used when constructing a confidence interval for .
-
(d)
The command in Python to compute is norminv(1-0.5*,0,1).
-
(e)
A confidence interval for will always capture .
-
(a)
-
2.
Assuming normality condition is satisfied and given , , and , compute the confidence intervals for in Excel.
-
(a)
, , .
-
(b)
, , .
-
(c)
, , .
-
(a)
-
3.
Assuming normality condition is satisfied and given , , and , compute the confidence interval for in Python.
-
(a)
, , .
-
(b)
, , .
-
(c)
, , .
-
(a)
-
4.
In a random sample of 64 people in a city, 37.5% were in favor of lowering the drunk driving blood alcohol level from 0.1 to 0.08. Fin a 90% confidence interval for the population proportion in favor of lowering the drunk driving blood alcohol level from 0.1 to 0.08. Interpret the confidence interval in the language of the problem.
-
5.
Given the data set Bostrain.xlsx, construct a 95% confidence interval estimate of the proportion of Wednesdays with precipitation. Assume that values diffferent from 0 to be days with precipitation. Interpret the confidence interval in the language of the data.
-
6.
Assume that a coin is modified so that it favors head and 100 tosses results in 90 heads. Find the 99.99% confidence interval estimate of the proportion of heads that will occur with this coin. What is unusual about this confidence interval? How can it be modified?
-
7.
Create an Excel worksheet that allows you to enter , , and and will outright compute the confidence interval for . This should be user-friendly with labels on the three inputs.
-
8.
Create a Python script that allows you to enter , , and and it outputs the confidence interval for , printed nicely.