5.7 Simulations
| Goal: |
|
We have constructed enough Python to do the simulations outlined in Chapter 2.
5.7.1 Family Planning Simulation
Recall the family planning scheme introduced in Section 2.1: A couple will have kids until having a boy or having three kids. What is the average number of girls in such a family?
Our goal is to write some Python that will generate simulated outcomes, i.e., will generate the number of girls in a large number of simulated families using the plan. Once we have the sample, we can calculate the sample mean to estimate the average number of girls for all such families.
It’s important to approach this type of problem using a divide-and-conquer approach: Divide the problem into smaller, more manageable chunks, adding the chunks together to solve the whole. In this case, our first goal will be to simulate a single family. Here is the pseudo-code as discussed previously:
-
1.
Flip the coin until a stopping criterion is met (a boy is born but no more than three kids).
-
2.
Count the number of girls, and then add that as a data point in the sample.
We could handle this using a loop, but since the maximum number of kids is three, we can also do this using a small number of nested if statements. We will take the latter approach, not because it is the “best” way, but only as way to illustrate. Here’s the gist of simulating a single family, broken down using three if’s:
- [nolistsep]
-
Have a child
-
If the child is a boy, then output 0
-
Else
-
Have a child
-
If the child is a boy, then output 1
-
Else
-
Have a child
-
If the child is a boy, then output 2
-
Else
-
Output 3
-
-
-
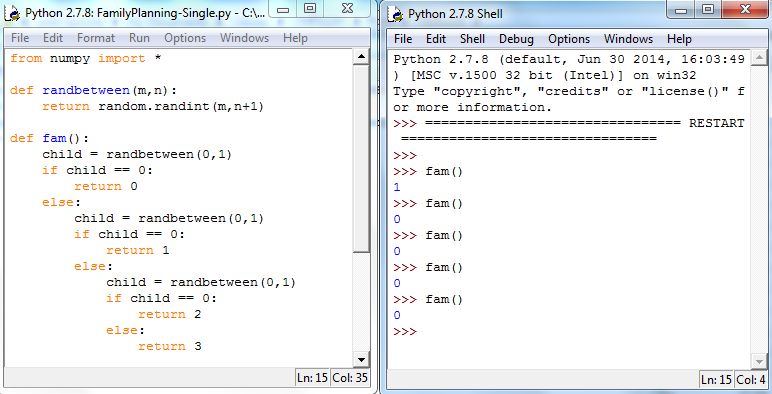
To simulate having a child, we can use randbetween(0,1), where 0 denotes having a boy, and 1 denotes having a girl (or vice versa). The following gives Python code for simulating a single family using this strategy:
We can define a function that executes this code. Each time the function, say fam, is executed, a family is simulated and a count of girls in the family is generated, as shown in Figure 5.23.
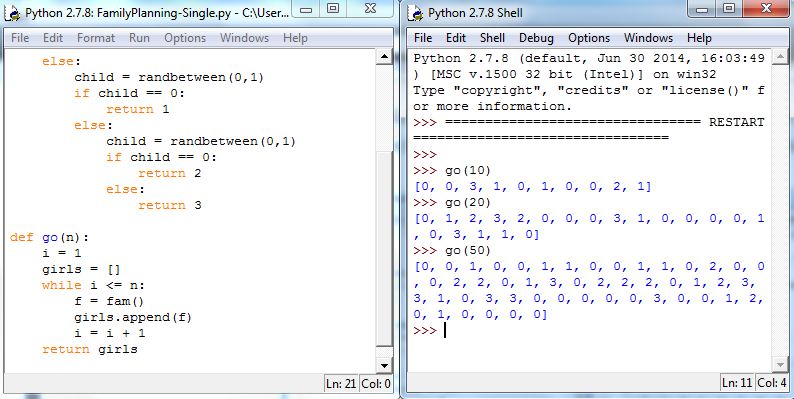
We are now in position to complete the simulation code. We need only write a loop that calls fam repeatedly and keeps track of the outcomes. We’ll do this in a way that may not be the most efficient, but emphasizes that we are building a sample of simulated data, i.e., we will use a list to store the data points. Here is a definition of a function go that will generate a sample of desired size:
Figure 5.24 shows go in action. The Shell shows the sample output of go as well as computing sample means of samples generated by go.
Changing the return command in go to return mean(girls) completes the code. Figure 5.25 illustrates:
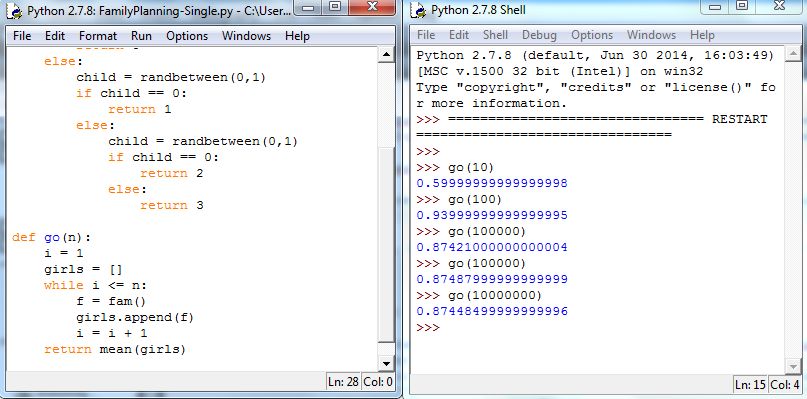
Concepts Check: 1. Based on the output in Figure as the average number of girls in all families who use this plan? Answer: 2. What happens to the average number of girls if the chance of having a boy is ? Modify and run the code to investigate the change. (Assume the chance of having a girl is ) Answer: 3. What if the maximum number of kids is reduced to 2, i.e., suppose the family stops having kids after having a boy or having two kids. Modify the code to estimate the average number of girls in such families. Answer:
5.7.2 Redundancy Simulation
Recall the Redundancy Simulation example given in Section : A machine will stop working when a particular part called âGadgetâ breaks. In order to lengthen the time that the machine works, the machine has two Gadgets. One Gadget remains idle until the first breaks, at which point it activates. Suppose the probability that a Gadget breaks is each year, and suppose that when a Gadget breaks it does so only at the end of a year. What is the proportion of machines that run longer than 4 years?
Using a sequence of if’s, we could simulate a single machine in a manner similar to the Family Planning example, but to illustrate a different approach, we’ll use a loop. The loop will execute randbetween(0,2), simulating whether a Gadget fails in a given year. The loop terminates if two Gadgets fail in four years or less.
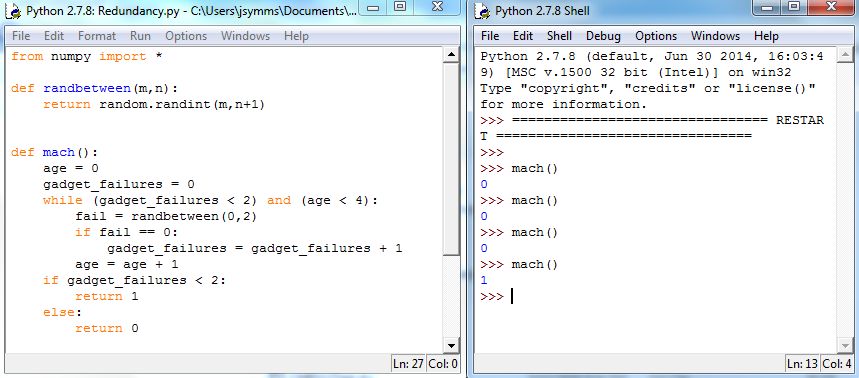
The following Python code simulates a single machine. In executing randbetween(0,2), the code uses 0 for denoting failure of a Gadget. For reasons that will be made more clear shortly, the code outputs a 0 if the machine fails within 4 years, and 1 otherwise.2020Anything can work as output, but what is chosen has impact on subsequent work.
Figure 5.26 shows the code, called mach:
As with the Family Planning simulation, it is now a matter of iterating repeated calls of mach, keeping track of each generated data point. The function go shown in Figure 5.27 executes mach input n times, storing each data point into the list sample. When complete, go returns sample.
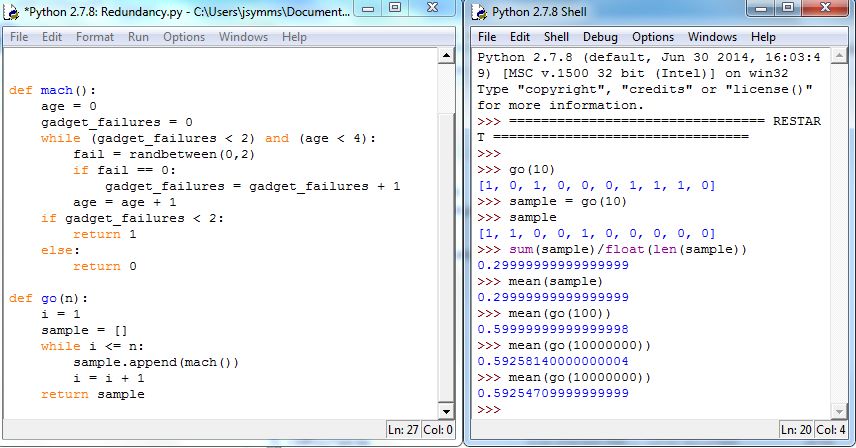
The output shown in Figure 5.27 shows how the choice of data values 0 and 1 work. To estimate the proportion of all machines that last longer than 4 years, if sample is the output of go, then we need to compute
Since the machines that fail are denoted by 0, then the count of all 1’s in sample is the same as the sum of all the data points in sample. Recalling that len computes the length of a list, the ratio
| (5.1) |
would give the desired proportion. But, recall that one of the numerator or denominator needs to be a floating-point number to get a floating-point approximation, so the following Python command computes the sample proportion of 1’s:
| (5.2) |
Figure 5.27 illustrates this calculation. But, Equation (5.1) shows something else: the desired calculation can be done by computing the mean of sample, i.e., mean(sample) gives the same result as (5.2), as is also shown in Figure 5.27.
5.7.3 Exercises
In each of the following, use Python to conduct a simulation that generates an approximation to the given question.
-
1.
What is the average number of flips of a fair coin until a head occurs?
-
(a)
First, write a function, say flip, that simulates flipping until a head occurs. Make the function return the number of flips needed.
-
(b)
Then, write a function, say go, that repeatedly calls on flip. The function should take as input the number of iterations, and output the sample mean. Use a list to store the sample.
-
(c)
What is your estimate for the average number of flips needed?
-
(a)
-
2.
What is the average number of flips of a fair coin until two successive heads occur?
-
(a)
First, write a function that simulates flipping until two successive heads occur.
-
(b)
Then, write a function that repeatedly calls on the prior.
-
(c)
What is your estimate for the average number of flips needed?
-
(a)
-
3.
What is the average number of rolls of a fair, standard 6-sided die until a 1 is rolled?
-
4.
What is the average number of rolls of a fair, standard 6-sided die until two successive 1’s are rolled?
-
5.
Suppose you flip a fair coin four times, recording each flip in order. Which outcome is more common, or ?
-
6.
An unfair 6-sided die has sides marked with the numbers 1, 2, 3, 4, 5 and 6. The probability of rolling a 1 is while the probability of rolling each of the other numbers is If the die is rolled twice, what is the probability that the sum of the two rolls is 7?
-
7.
As we age, the probability that we survive one more year changes. For example, the probability of a 20-year-old woman dying is approximately 0.0004, while it is approximately 0.003 for a 50-year-old woman. Suppose that the probability of someone dying remains fixed from birth, and that this probability is 0.0004. What is the average lifespan?
-
8.
A problem posed by the American statistician Steve Selvin can be stated as follows: Suppose that you are on a game show in which the emcee presents three doors to you. Behind one door is a brand new car, while the other two each hide a goat. The emcee asks you to pick a door, and let’s you know that you will get to keep what is behind the door your choose. After you pick a door, the emcee opens one of the two doors you did not pick to reveal a goat. The emcee then offers you opportunity to change your choice to the other closed door. Should you?