4.2 Simulations
| Goals: |
|
4.2.1 Sum of Weighted Dice Thrown Simulation
Imagine the following problem.
You are given three 6-sided, weighted dice. (Figure 4.10 shows the likelihood of each side for a particular die is to show up.) If you were to sum of the sides of each die thrown, what would the most likely outcome be?
| Dice No. | Side 1 | Side 2 | Side 3 | Side 4 | Side 5 | Side 6 |
|---|---|---|---|---|---|---|
| #1 | 0.15 | 0.2 | 0.425 | 0.1 | 0.05 | 0.025 |
| #2 | 0.025 | 0.025 | 0.05 | 0.05 | 0.6 | 0.25 |
| #3 | 0.1 | 0.1 | 0.1 | 0.1 | 0.1 | 0.5 |
Let’s simulate this problem in Excel.1515Note that this problem can also be done theoretically. For the purposes of this text, we are motivated to simulate instead. From the description of the problem, the ultimate goal is to determine the possible outcome(s) that attains the largest population proportion.
The description of the problem states that each time we roll, we will be rolling all three dice and adding up the face values of the dice. Recall that the more samples taken, the better estimate the sample proportions seemed to be to that of the population proportion. So let’s generate a sample size of 5000 dice rolled. Using Data Analysis TookpakRandom Number Generator, let’s generate a sample of 5000 rolls of each die. Take note the weights for the dice in Figure 4.10. Figure 4.11 shows a snapshot of the 5000 rolls generated.
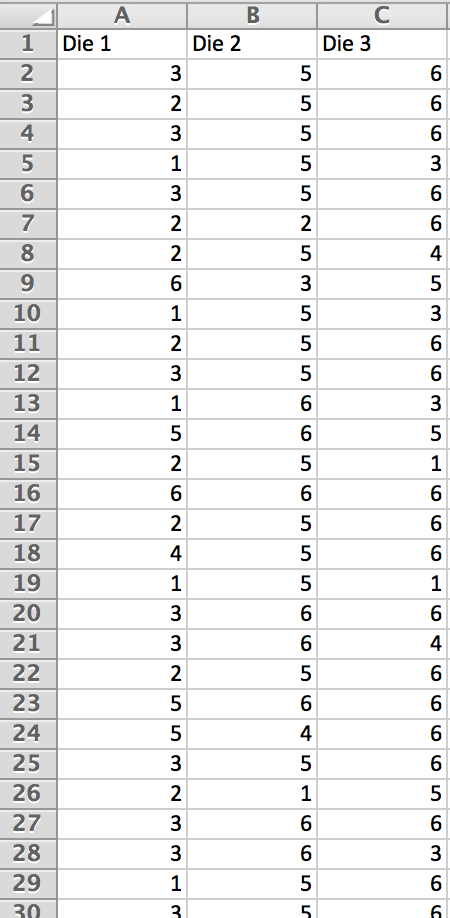
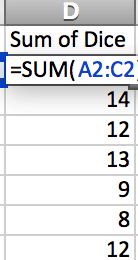
In column , we will add up each roll using the command.
Before we create a frequency distribution, we need to determine what are all of the possible outcomes. Since the lowest side we could roll is a 1, then the smallest sum we could attain is 3. Similarly, the largest is 18. Therefore, we have the following outcomes that are possible.
| Outcomes: | 3 | 4 | 5 | 6 | 7 | 8 | 9 | 10 | 11 | 12 | 13 | 14 | 15 | 16 | 17 | 18 |
|---|
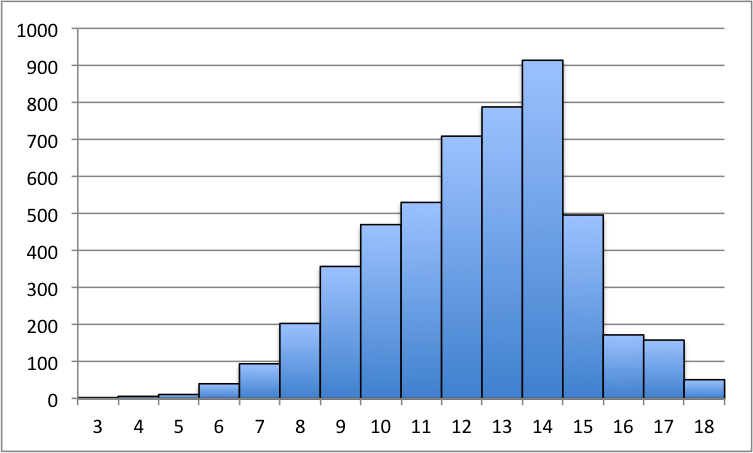
Create a frequency distribution with each of the outcomes as bins. We are interested in the sample proportions of each of the outcomes. Recall that we are trying to determine which outcome is more likely to occur. The one with the highest sample proportion will answer this question. Calculate the sample proportions of each of the outcomes.
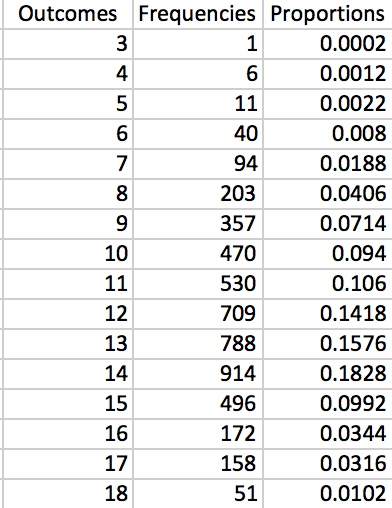
As you can see, the most likely outcome is 14.
4.2.2 Family Planning Simulation
Recall the following low-tech simulation problem:
A couple will have kids until they have a boy or they end up having three kids. What is the average number of girls in such a family?
There are essentially two processes we need to focus on while simulating this problem.
-
1.
Produce children until a boy is born or no more than 3 children result.
-
2.
Count up the number of girls from each family. Each sample data value will be describe the total number of girls in each family.
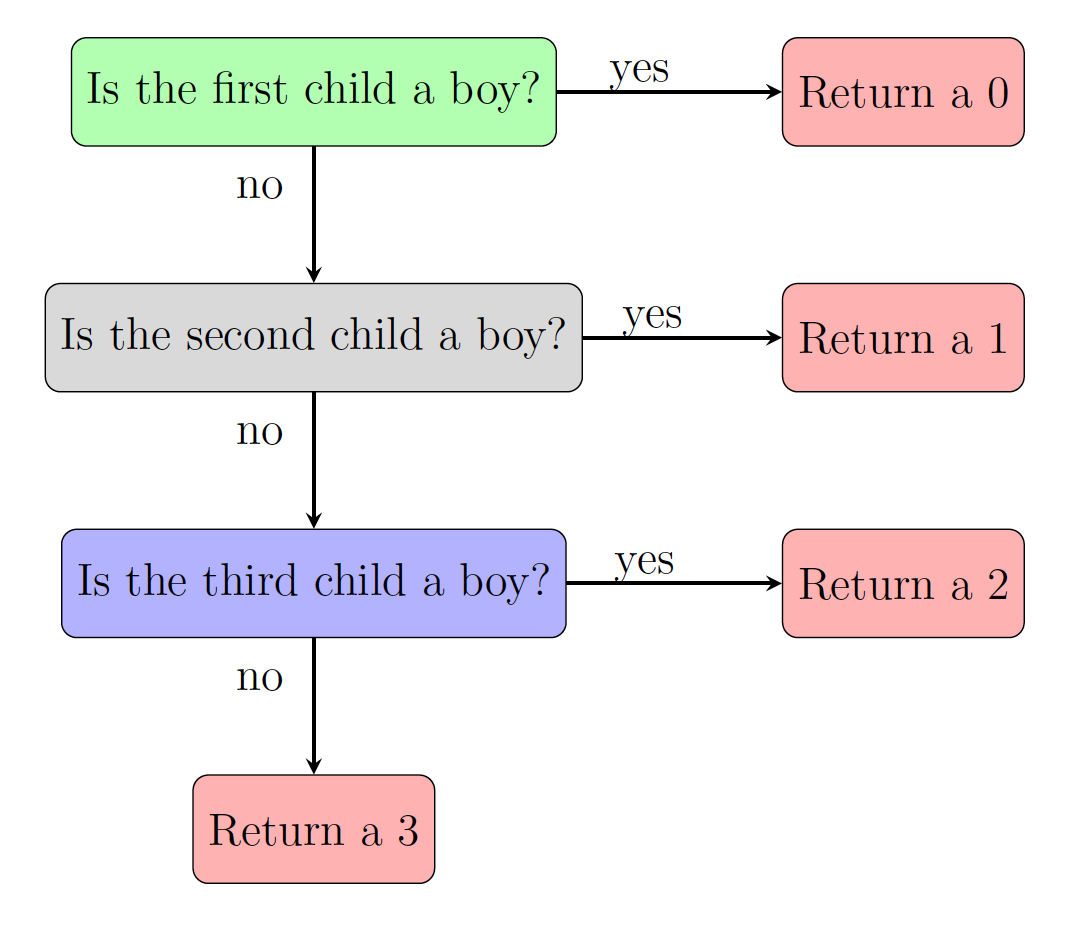
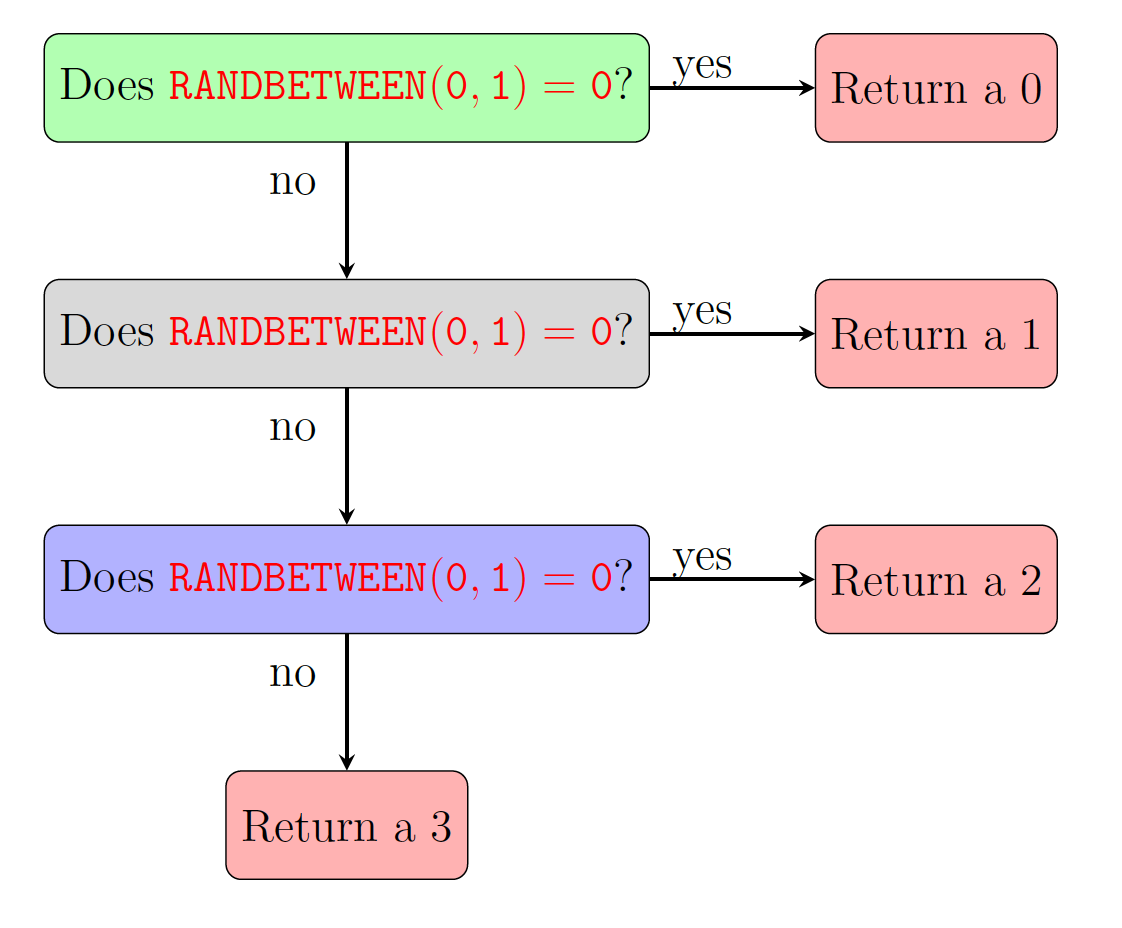
Breaking this problem apart, we see that for each family we need to systematically check the first child to see if it is a boy. If it is, then the family is done producing children and there is no girls in the family. If it is a girl, repeat the process. Figure LABEL:fig:FamPlan depicts the flow chart associated with this process.
The question is at each iteration how do we generate the children? The only two equally likely outcomes of children are boy or girl. Let’s associate a numeric value to each. Suppose
We can use the command to generate a zero or a one.
So, we are checking each step whether . (Why again?) Let’s amend the flow chart with the in place of Is the …child a boy. Figure LABEL:fig:FamPlan1 shows this. Since we are checking three steps to see if a boy is produced, we will have three if statements. Don’t forget that this flow chart represents the process to determine how many girls are in one family.
So the following is the necessary Excel command that will simulate one family and calculate the total number of girls in such family.
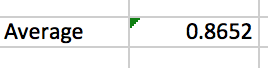
In Excel, let’s simulate 5000 families. The figure below shows a snapshot of the families simulated.
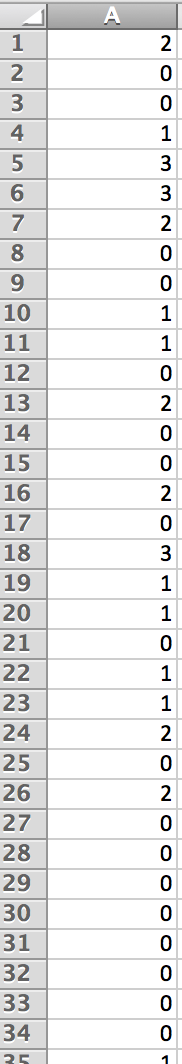
In an adjacent cell, let’s compute the sample average of girls per family. In our case, we obtain .
 Skewed Left Distribution
2.
What is the least likely to occur throw from the weighted dice simulation?
Answer: 3
3.
Construct a flow chart to show what would happen if a family is allowed to produce children until they have a girl or no more than 4 children.
Answer:
Skewed Left Distribution
2.
What is the least likely to occur throw from the weighted dice simulation?
Answer: 3
3.
Construct a flow chart to show what would happen if a family is allowed to produce children until they have a girl or no more than 4 children.
Answer: 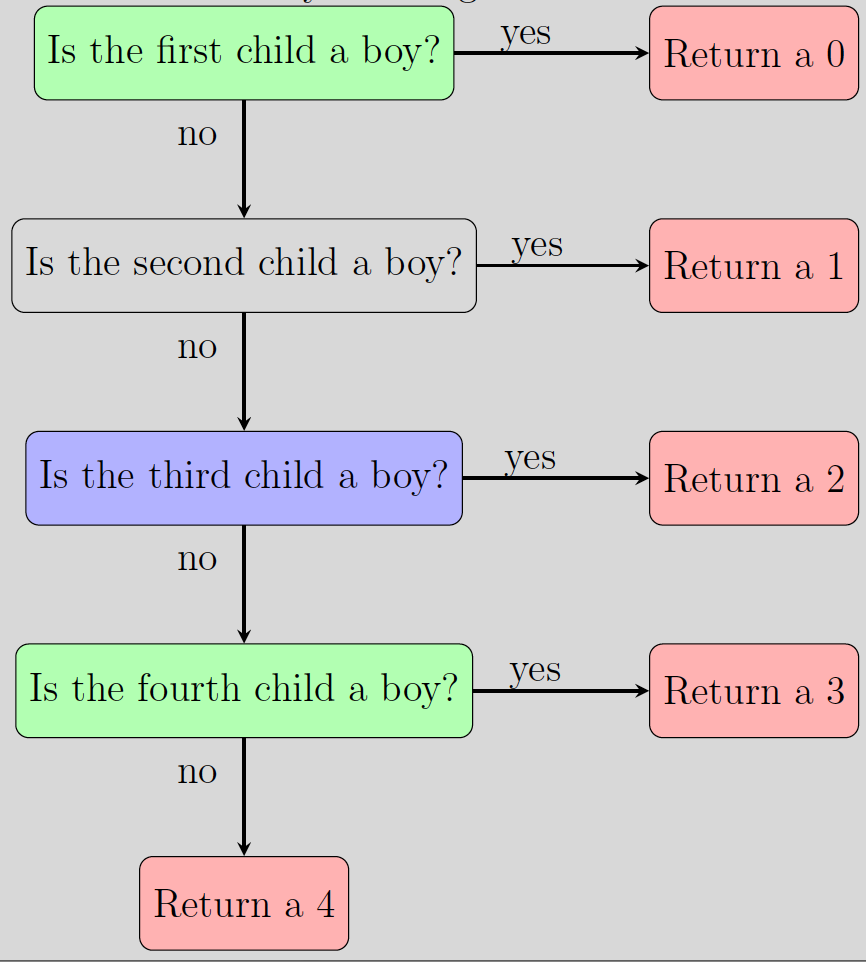
4.2.3 Exercises
In each question, use Excel to conduct a simulation that generates an approximation to the given question.
-
1.
Two, fair, 6-sided dice are rolled and summed up. What outcome is most likely to occur?
-
2.
Three, fair, 6-sided dice are rolled and summed up. What outcome is most likely to occur?
-
3.
A standard deck of 52 cards is shuffled. What proportion will a king or a club show up?
-
4.
Recall the family planning simulation example. Assume that the chances a boy occurring is now 1 out of 4. Answer the following.
-
(a)
What would the average number of girls per family be if the family has children until a girl occurs or no more than 3 children occur?
-
(b)
What would the average number of girls per family be if the family has children until a girl occurs or no more than 4 children occur?
-
(a)
-
5.
A random integer is generated between 1 and 200. Answer the following.
-
(a)
Estimate the proportion of numbers generated occurring strictly between 23 and 89.
-
(b)
Estimate the proportion of numbers generated occurring between 23 and 89, including 23 and 89.
-
(c)
Is there much of a difference between either of the two scenarios? Explain.
-
(a)
-
6.
Simulate flipping a fair coin 1000 times. On your spreadsheet, note which result denotes “heads” and which denotes “tails.” Compute the proportion of “heads,” and the proportion of “tails.” Create a bar chart showing both proportions. Does it appear the simulation reasonably approximated flipping a fair coin?
-
7.
Simulate 500 times the following random process: a fair coin is flipped twice, with the outcome being the total number of “heads.” Compute the sample mean for the 500 trials. Is the sample mean close to what you expected?
-
8.
The height of a rocket is described by the equation , where is in seconds. Perform the following.
-
(a)
Generate a simple random sample of 1000 values of between 0 and 20 seconds by manipulating the command .
-
(b)
Evaluate the height of the rocket at each of the 1000 random times. Using the command , find the maximum height out of the 1000 random heights and the time in which it occurs.
-
(c)
Estimate the maximum height of the rocket by repeating the previous two steps 5 more times. At what time does the rocket achieve the estimated maximum height?
-
(a)