14.1 Curve of Best Fit
| Goals: |
|
There are many situations in which two continuous random variables, and , are related to one another. The question is, “how are they related?” Or another question one could ask is, “if one of the variables changes, how does the other change?” In order to determine a particular relationship, we rely on using a method of regression.
Definition.
Method of Regression Statistical technique that involves collecting data sets corresponding to variables and and determining the mathematical relationship between the two random variables.
In order to use a particular method of regression, is important to first classify what are the independent and dependent variables.
Definition.
Independent/Dependent Variable The dependent variable, often denoted as , is the variable that varies and is dependent on another variable. This other variable, called the independent variable, often denoted as , is the variable that is controlled.
So our objective to show a relationship between the variables and . Ideally, we would like to find a function that maps values data values of to data values of . In mathematics, such a function is often denoted as .
Let’s briefly go through a few examples of different methods of regression.
-
•
Linear Regression: Here the goal is to find a linear relationship between and , assuming that and are continuous random variables. That is, we would like to write
where is the slope and is the -intercept. Below is an example of pairwise data values from and , written as , plotted on the cartesian plane (-plane) that somewhat show a linear relationship. A line is approximated and calculated to best describe the relationship. Can you see the estimated line?
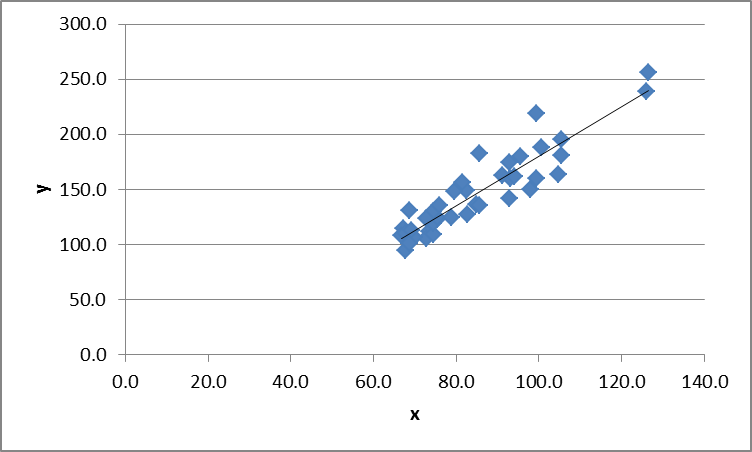
Figure 14.1: Linear regression example -
•
Quadratic Regression: In quadratic regression, the goal is to find a quadratic relationship between and , assuming that and are continuous random variables. That is, we would like to write
where and are real numbers. Below is an example of data that exhibits a quadratic regression. Notice the parabolic-like curve that fits the data.
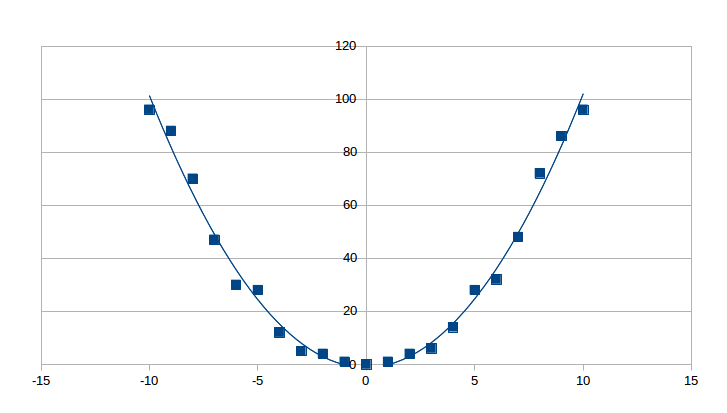
Figure 14.2: Quadratic regression -
•
Sinusoidal Regression: In sinusoidal regression, the objective is to find a sinusoidal (sine function) relationship between and , assuming that and are continuous random variables. That is, we would like to write
where and are real numbers. Below is an example of such a sine-like curve that fits the data.
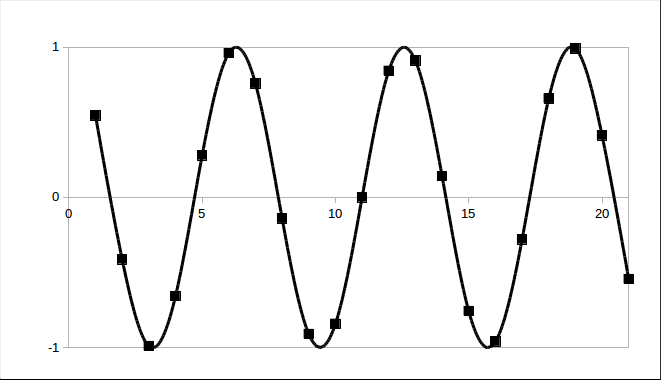
Figure 14.3: Sinusoidal regression
There are other types of regression not described here, such as logarithmic regression and logistic regression. For the purposes of a brief introduction, we leave out the details for these types and others. A subsequent regression analysis course would elaborate further on the different types of regressions that are possible. In this chapter, we will focus on linear regression.