9.7 Exercises
-
1.
Write out and for the following scenarios.
-
(a)
A tire manufacturer claims that their tires last for an average of 50,000 miles. We think that claim is too high.
-
(b)
An ad in the college newspaper claims that the average rent for a two-bedroom apartment near campus is $750 per month. We think that claim is too low.
-
(c)
A headache medicine claims that its time to relief is thirty minutes. We want to see if that claim is accurate.
-
(d)
While grading final exams, a physics professor gets the feeling that scores are lower than normal (80%) this semester. She decides to test that feeling empirically.
-
(a)
-
2.
Two identical-looking populations contain numbers as shown in Figure 9.22.
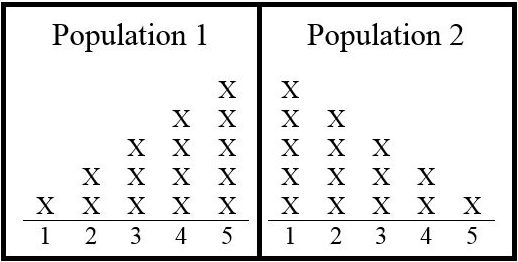
Figure 9.22: Population 1 & 2 One of the populations is selected, and a single number is selected. The competing hypotheses are:
-
The number was selected from Population 1.
-
The number was selected from Population 2.
-
(a)
What is the direction of extreme? To the left, to the right, or two sided?
-
(b)
A significance level of 0.2 is chosen.
-
i.
What is the critical value?
-
ii.
What is the corresponding value of
-
i.
-
(c)
Suppose that from the selected population, a 1 is chosen.
-
i.
What is the -value?
-
ii.
If what decision is made?
-
iii.
What error might have occurred, Type I or Type II?
-
i.
-
-
3.
Two populations consist of numbers as shown in Figure 9.23.
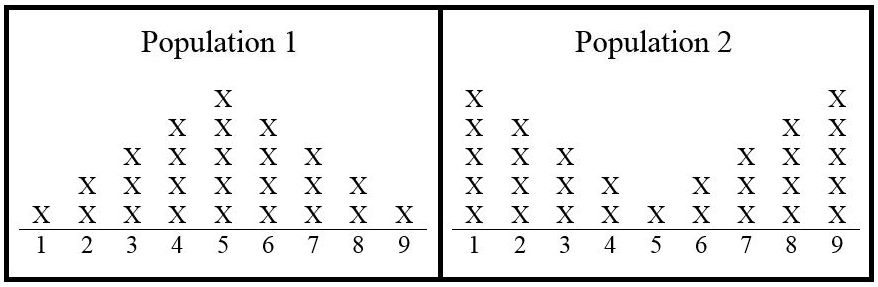
Figure 9.23: Populations 1 & 2 One of the populations is selected, and a single number is randomly selected. The competing hypotheses are:
-
The number was selected from Population 1.
-
The number was selected from Population 2.
-
(a)
What is the direction of extreme? To the left, to the right, or two sided?
-
(b)
A significance level of 0.08 is chosen. What is the corresponding value of
-
(c)
Suppose that from the selected population a 9 is chosen.
-
i.
What is the -value?
-
ii.
If what decision is made?
-
iii.
What error might have occurred, Type I or Type II?
-
i.
-
(d)
Suppose that from the selected population a 3 is selected. What is the corresponding -value?
-
-
4.
Two populations contain numbers as shown in Figure 9.24.
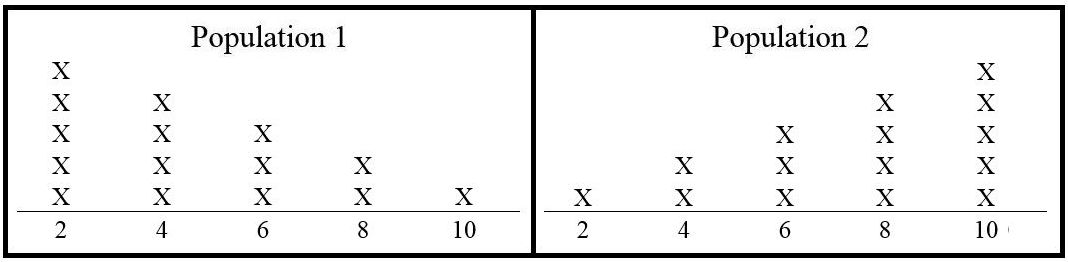
Figure 9.24: Populations 1 & 2 One of the populations is selected, and a single number is selected. The competing hypotheses are:
-
The number was selected from Population 1.
-
The number was selected from Population 2.
-
(a)
What is the direction of extreme? To the left, to the right, or two sided?
-
(b)
The decision rule is “reject if the selected number is 8 or more extreme.”
-
i.
What is the corresponding value of
-
ii.
What is the corresponding value of
-
iii.
Suppose that a 10 is chosen. What is the -value?
-
iv.
If a 10 is chosen, what is the decision, reject or fail to reject
-
v.
What error might have occurred, Type I or Type II?
-
i.
-
-
5.
Using the populations and hypotheses given in problem 1, do a simulation in Excel of selecting a single number from a randomly selected population. Use a decision rule of “reject if the selected number is 2 or more extreme.”
-
(a)
Check that the proportion of Type I errors that occur when is true is approximately equal to
-
(b)
Check that the proportion of Type II errors that occur when is false is approximately equal to
-
(a)
-
6.
Using the populations and hypotheses given in problem 1, do a simulation in Excel of selecting a sample of size 2 from a randomly selected population. Assume sampling with replacement. Use a decision rule of “reject if the sample mean is 2 or more extreme.”
-
(a)
Approximate by computing the proportion of Type I errors that occur when is true. Compare this value with the in the prior problem.
-
(b)
Approximate by computing the proportion of Type II errors that occur when is false. Compare this value with the in the prior problem.
-
(a)
-
7.
Using the populations and hypotheses given in problem 1, do a simulation in Excel of to estimate the -value if a sample mean of 2.0 is observed from a random sample of size 2.