11.2 Example
If we have conducted a survey in which the answers are qualitative, we can compute the proportion of the responses from the group(s) we are interested in, such as married people or college sophomores, and use that proportion to test a hypothesis.
Suppose we conducted a survey asking people if they plan to vote in the upcoming election and then tabulated their responses. The results are as follows.
| Sex | Yes | No | Not Sure | Total |
|---|---|---|---|---|
| Male | 258 | 210 | 48 | 516 |
| Female | 324 | 196 | 52 | 600 |
Let’s say that we want to test the hypothesis that at least half of all women plan to vote in the upcoming election. Our hypotheses would be written
Where p is the proportion of women in the population we are sampling from who plan on voting in the upcoming election.
We will test our hypotheses using .
The first thing we need to do is to compute the proportion of women in our sample who plan on voting in the upcoming election. We can then use the sample proportion as a proxy for the population proportion. Calculating sample proportion is simple:
| (11.1) |
Where (pronounced p hat) is our sample proportion; x is the number of defined successes; and n is our appropriate sample size. A success is defined as the quantity we are interested in. In this case, we are interested in the number of women who answered ’yes’ to the question, ”Do you plan on voting in the upcoming election?” Our sample size is the total number of women who answered the survey question. In this example, we had x = 324 and n = 600. Therefore,
So 54% of the women in our survey said that they plan on voting in the upcoming election. 54% is obviously more than half (50%), but we can’t simply state that our original hypothesis is correct. We need to test these results objectively. We need to use statistics on them to make sure that 0.54 is far enough above 0.50 to say confidently that it is greater than 0.50, i.e., most women plan to vote in the upcoming election.
We can use Z as our test statistic as long as both of the conditions for normality are met. These conditions are
and
In our example, we have n = 600 and = our assumed proportion, which is 0.50:
and
since both results are greater than 5, the conditions of normality are met.
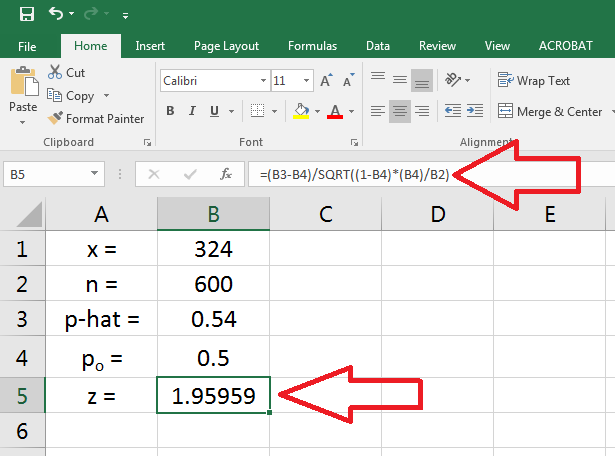
The formula for Z is
| (11.2) |
is our sample proportion; is the assumed proportion (the one we are testing against); and n is our sample size.
So our example numbers are
Using these values we get
Now that we have our test statistic, we can compute our p-value. Since states ¿ 0.50, we need to find the area under the normal curve that is above (to the right of) our Z-score.
We can use Excel for this by using the NORM.DIST function. The only thing we need to remember is that NORM.DIST only gives areas below (to the left of) a value. Since we want the area above our Z-score, we need to subtract the number we get from one. Also, since we are basing our p-value calculation on a Z-score, we can use the NORM.S.DIST function. This function bases its calculations on the standard normal curve rather than the normal curve that is generated based on the actual values being used. We need to use Excel to calculate our Z-score first:
Now we can use the NORM.S.DIST function in Excel to get our p-value. In the dialog box that pops up, we enter the cell where our Z-score is and we always enter ’True’ in the box for Cumulative.
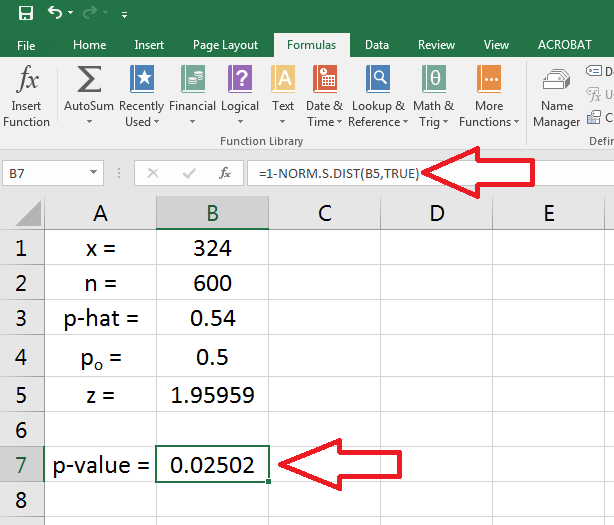
Our p-value = 0.02502, which is less than alpha, so we can reject and say that the proportion of women who plan to vote in the upcoming election is greater than 0.50. In other words, most women plan to vote in the upcoming election.
Be careful to say proportion of women, not number of women when discussing your results. The number of successes in one survey may be greater than the number of successes in another survey, but end up being a smaller proportion due to different sample sizes. This is an important distinction to keep in mind.
For example, in our hypothetical survey results, if the number of men who said they would vote in the upcoming election was 310 out of 516 instead of 258 out of 516, then the proportion of men would have been .6, which is a higher proportion than the .54 for the women who plan to vote in the upcoming election, but the 310 successes for the men is less than the 324 successes for the women. So simply saying, ’number of’ instead of ’proportion of’ can be misleading if not outright incorrect.